A Slowing Recovery
There were two distinct themes at play in the markets during the third quarter. Markets were initially buoyed by surprisingly strong economic and earnings reports. Almost 1.8 million new jobs were added in July and corporate profits came in a record 23% higher than expectations. The good news was enough to overcome a mid-year resurgence of the virus and a second wave of infections.
Investors switched their focus to fiscal stimulus in September as the pace of economic recovery began to slow. Stimulus from the CARES Act started to wane and concerns about a fiscal cliff began to emerge.
At the same time, the November elections came into sharper focus and added to uncertainty and volatility. Investors were initially troubled by the prospect of a Biden win and a Democratic sweep because of the potentially damaging impact of higher taxes on economic growth.
Stocks posted impressive gains through this ebb and flow in activity and sentiment. The S&P 500 index was up 8.9% in the third quarter, the Nasdaq 100 index gained 12.6% and the Russell 2000 index rose 4.9%.
Debt and Taxes
Investors are especially worried about the fiscal policy bridge to a post-Covid economy at this point in time. A few of the vaccine trials have recently slowed down and a third wave of the virus looms in the winter months. Congress is still working to pass another round of fiscal stimulus despite ongoing negotiations for several weeks.
The panacea of fiscal stimulus as an economic remedy poses a difficult dilemma for investors. On one hand, they are aware that it has helped reverse the sharpest recession we have ever experienced. On the other hand, the continued emphasis on fiscal stimulus has also fanned fears about the sustainability and consequences of high debt levels.
We address these issues in our discussion of debt and taxes.
- Will greater deficits inevitably lead to higher taxes?
- Will a change in administration inevitably lead to higher taxes as well?
- Will higher taxes inevitably lead to slower growth?
Let’s begin with a look at the projected levels of debt and deficits.
Size of Debt and Deficit
The V-shaped recovery has been used liberally to describe the economic and stock market rebound. It also curiously shows up in a discussion of the budget deficit.
Figure 1 shows the projected levels of budget deficits from the Congressional Budget Office (CBO) over the next decade.
It is interesting to note that the projected budget deficit traces a symmetrical V-shape created by a big decline in 2020 and then a sharp turnaround in the next 3 years.
Figure 1: U.S. Budget Deficit as % of GDP
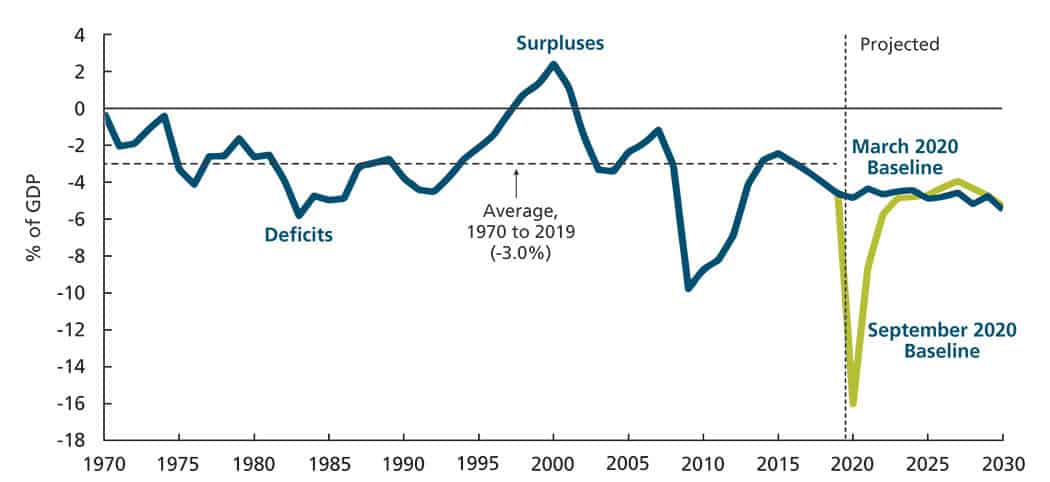
The larger deficit in 2020 reflects the legislation that has been enacted to counter the economic disruption from the pandemic. The budget deficit balloons from just below $1 trillion in 2019 or 6% of GDP to $3.1 trillion in 2020 or 15% of GDP. The 2020 deficit as a percentage of GDP is the largest since 1945.
The budget deficit recovers in the next few years because of lower projected interest rates and inflation. It reverts back to pre-Covid levels and is projected to be at 5.3% of GDP in 2030.
This unexpected increase in the deficit has also caused debt to soar to levels not seen since 1946.
Figure 2 shows the projected levels of federal debt from the CBO over the next decade.
Figure 2: Federal Debt Held by Public as % of GDP
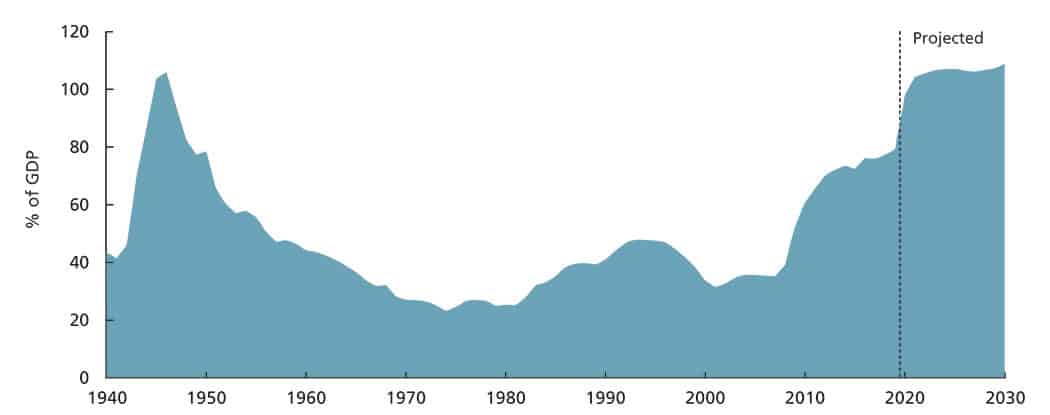
Total national debt is estimated to be just above $26 trillion. About 23% of this total debt is held by other federal agencies. For our discussion here, we focus on the remaining 77% or about $20 trillion of debt held by the public.
As we can see, the public debt to GDP ratio was about 35% in 2007 and around 80% in 2019. It is projected to exceed 100% in 2021 and then plateau at around 109% for the rest of the decade.
Validity of Fiscal Stimulus So Far
We have unleashed $3 trillion in fiscal stimulus so far. It is quite likely that we will implement more stimulus of $1.5 to $2 trillion.
Is this aggressive policy appropriate for a crisis of this nature? Have we already made a mistake and created an even bigger debt problem with fiscal stimulus of this magnitude?
We answer these questions from two fundamental economic perspectives.
Excess Slack in Economy
We know fiscal policy is counter-cyclical by design. Higher government spending is intended to offset falling demand during a recession. It is also geared to put idle resources to productive use.
It stands to reason then that the size of fiscal stimulus is calibrated to the amount of excess slack in the economy.
So how much slack was created in the U.S. economy because of Covid?
We refer to the two common metrics that are used to gauge the health of an economy — inflation and unemployment.
Inflation first. The Fed’s preferred inflation gauge is the Personal Consumption Expenditure (PCE) price index. It fell sharply from about 2% in February to just half a percent in May. It currently stands at less than 1%.
The Fed has long targeted inflation at 2% and inflation has long fallen short of that 2% threshold. Inflation has been below target for a long time and that slack has only become bigger after Covid.
Unemployment is the other common gauge of economic activity. In the longest expansion of the U.S. economy, unemployment fell to a scarcely believable 3.5%. In the coronavirus recession, it spiked up to an equally unbelievable 14.5%. The sharp increase in unemployment created more slack in the U.S. economy.
The magnitude of slack in both inflation and unemployment has been consistent with the amount of fiscal stimulus we have seen so far. With inflation well below 2% and the unemployment rate at a still high 7.9%, there is room for additional fiscal stimulus.
Chairman Powell recently reiterated that the risks of policy intervention are still asymmetric — “too little support would lead to a weak recovery … and if policy actions ultimately prove to be greater than needed, they will not go to waste since the recovery will be stronger.”
We draw upon another conventional metric, the fiscal multiplier, to hone in on the effectiveness of fiscal policy during a recession.
Asymmetric Fiscal Multiplier
The fiscal multiplier measures the change in GDP created by each additional dollar of deficit spending.
Figure 3 shows the fiscal multiplier across two different economic regimes as measured by the output gap. The output gap tells us if the economy is currently above or below its normal potential.
Figure 3: Average Fiscal Multiplier in G-7 Economies
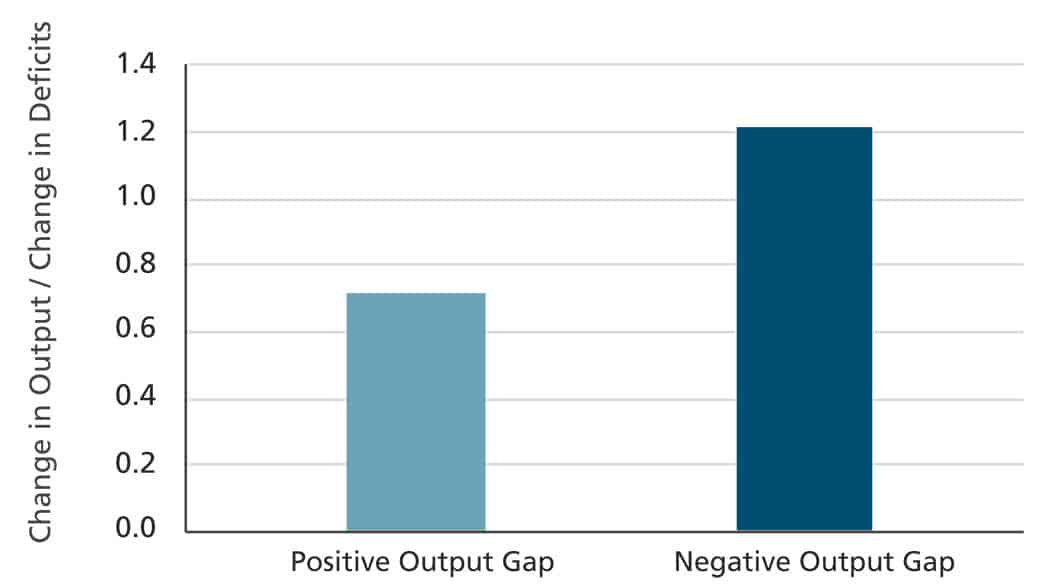
A negative output gap is created when inflation is below and unemployment is above normal levels. These conditions are normally encountered during recessions. We currently have a negative output gap in virtually all global economies.
As we can see above, the fiscal multiplier is asymmetrical across the economic cycle! It is more powerful when the output gap is negative. The fiscal multiplier is twice as big during recessions as it is when economies are expanding. The bigger the negative output gap, the bigger the fiscal multiplier.
The asymmetry of the fiscal multiplier reminds us that fiscal stimulus is particularly effective in recessions and more so in severe recessions.
We believe that fiscal policy responses have been appropriate in light of the massive disruptions created by the coronavirus pandemic.
The same two metrics of inflation and unemployment also help us understand the implications of high debt levels going forward.
Low inflation and high unemployment have allowed central banks to keep interest rates low through quantitative easing. Low interest rates in turn have eased the burden of high debt so far.
Let’s see how low interest rates can reduce fiscal costs.
Low Interest Rates
We look at both current and future fiscal costs e.g. the cost of servicing the debt now and also the possibility of higher taxes later.
Figure 4 shows Federal interest payments as a percentage of GDP from 1940 to 2019.
Figure 4: Federal Interest Payments as % of GDP
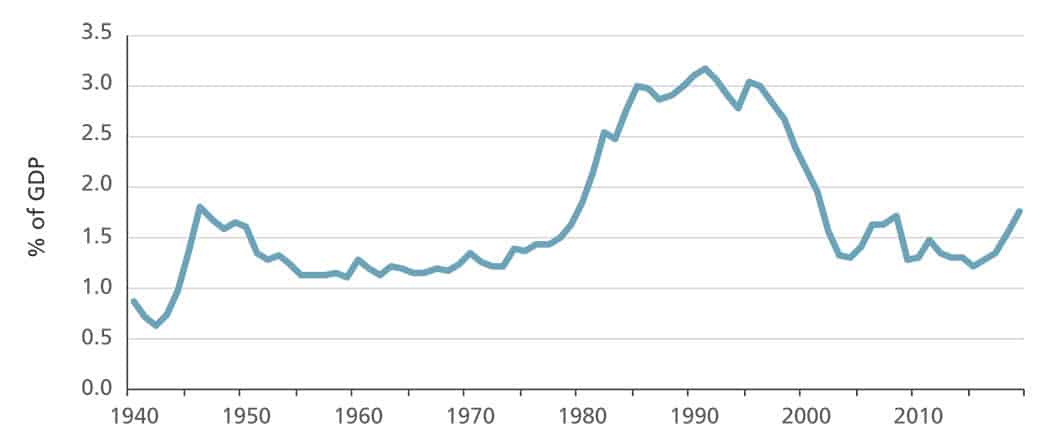
Interest rates have declined steadily for the last 30 years. As a result, interest payments as a percent of GDP have also declined over that period.
The decline in interest costs is quite remarkable when you consider the growth in public debt in that time. Federal debt in 2019 was more than double its level in the 1980s. Debt was twice as large and yet interest payments were almost half!
What will happen to interest costs after the sharp increase in debt in 2020? Even as public debt rises from around 80% of GDP to almost 100%, interest payments will fall by 10%. Based on CBO forecasts, interest payments will be 30% lower by 2022 because of continued low rates in the foreseeable future.
But the other implication of sustained low interest rates is more intriguing.
If interest rates remain low for a while, there may be a way to reduce the debt burden without raising taxes in the future.
Here is a simple framework to assess this possibility.
- Debt in any given year will increase by the nominal rate of interest and by any new deficit spending for that year.
- By way of a truism, GDP in any given year will grow at the rate of nominal GDP growth.
- If growth in GDP can exceed growth in debt, the debt to GDP ratio can actually come down … with no additional taxes.
Let’s see how likely this may be.
Figure 5 compares nominal interest rates to nominal growth rates in the U.S. for the last several decades.
Figure 5: GDP Growth Rates and Interest Rates, %
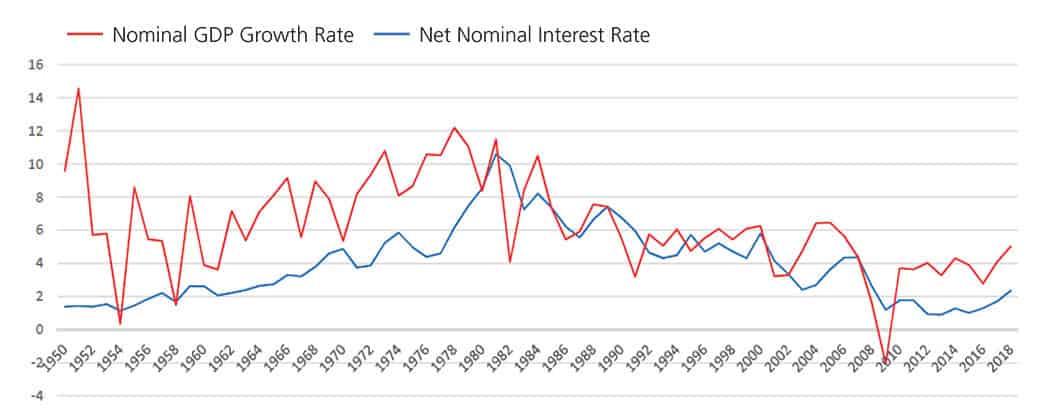
The red line shows the nominal GDP growth rate from 1950 to 2018.
The blue line is a fair measure of the nominal interest rate that the Treasury pays on its public debt. This interest rate accounts for the actual maturity of the public debt and also for taxes that the Treasury receives as an offset to its interest payments.
The trends in Figure 5 are encouraging.
GDP growth in the U.S. has exceeded interest rates by a wide margin for most of this time period. The only exception is the period after the oil shock in the 1970s.
If GDP growth can exceed interest rates and deficits in the future, it may be possible for the debt to GDP ratio to decline without significant fiscal costs.
We do not hold this out as a base case outcome but raise it as an interesting possibility for your consideration.
But how high can public debt go? What are its finite limits and boundaries? When will government spending eventually trigger inflation?
We offer some brief thoughts on debt, deficits and inflation.
The relationship between deficits and inflation over the last six decades is quite weak.
We have run a Federal deficit for most of this period. And yet inflation has been fairly muted over that period except in the 1970s. While deficits did grow from 0 to 5% in the 1970s, the spike of inflation was more attributable to the oil shock than the modest widening of the deficit.
The absence of inflation through the long economic expansion before Covid remains one of the big mysteries of modern economics. Some of the reasons that may continue to keep a lid on inflation include technology, precautionary savings and low inflation expectations.
In the near-term, uncertainty about the virus, the job market and the overall economy could lead to lower discretionary spending. Technology has increased competition, created price transparency and triggered business disruptions. As business cycles have become more muted, investors have become anchored to low inflation expectations. Inflation expectations have a strong feedback loop … low inflation expectations can actually lead to low realized inflation.
We know this is far from a complete discussion on inflation but suggest nonetheless that inflation and, therefore, interest rates may remain low in the medium term.
We close out our discussion with a look at the upcoming elections and the subsequent prospects of higher taxes.
Elections and Taxes
Will we see higher taxes in 2021?
The answer to this simple question is not straightforward. It depends critically on the election outcome. Who ends up in the White House? And how is Congress configured in November?
What we do know is how the candidates stack up on their tax initiatives. The Trump agenda calls for a reduction in taxes of about $1.8 trillion in the next 10 years. On the other hand, the Biden plan calls for tax increases of almost $4.1 trillion in the next decade.
The Biden tax plan is of bigger concern to investors because it may be restrictive to growth. We focus more on these concerns in our discussion; the choice is motivated by economics, not by politics.
Here are some of the key elements of the Biden tax plan. For income over $400,000, the highest marginal tax rate goes up from 37% to 39.6% and a new Social Security payroll tax of 12.4% goes into effect. For income above $1 million, capital gains get taxed at ordinary income tax rates. This effectively pushes the tax rate on capital gains from 23.8% to 43.4%.
The corporate income tax rate is proposed to go from 21% to 28%. And Biden also plans to eliminate the step-up in cost basis for inherited assets, instead taxing those gains at death.
The adverse impact of enacting all these tax increases on growth has been well-documented. It would likely require the support of almost all Democratic Senators, many of whom may be moderate or newly elected from conservative states.
However, we highlight a stimulative component of the Biden plan that may offset or perhaps even overcome the effect of taxes on growth.
The Biden agenda also calls for increased spending of $7.3 trillion. This spending comes from four categories – infrastructure, education, social safety nets and healthcare. Infrastructure is the largest category of spending at about $2.4 trillion and healthcare is the smallest at around $1.5 trillion.
These spending plans are projected to bolster growth through more fiscal stimulus. Several studies have now shown that the Biden plan may not be as damaging to growth as originally feared. Figure 6 shows growth projections over the near term from one such analysis.
Figure 6: Forecast for GDP Growth, 2021-2024
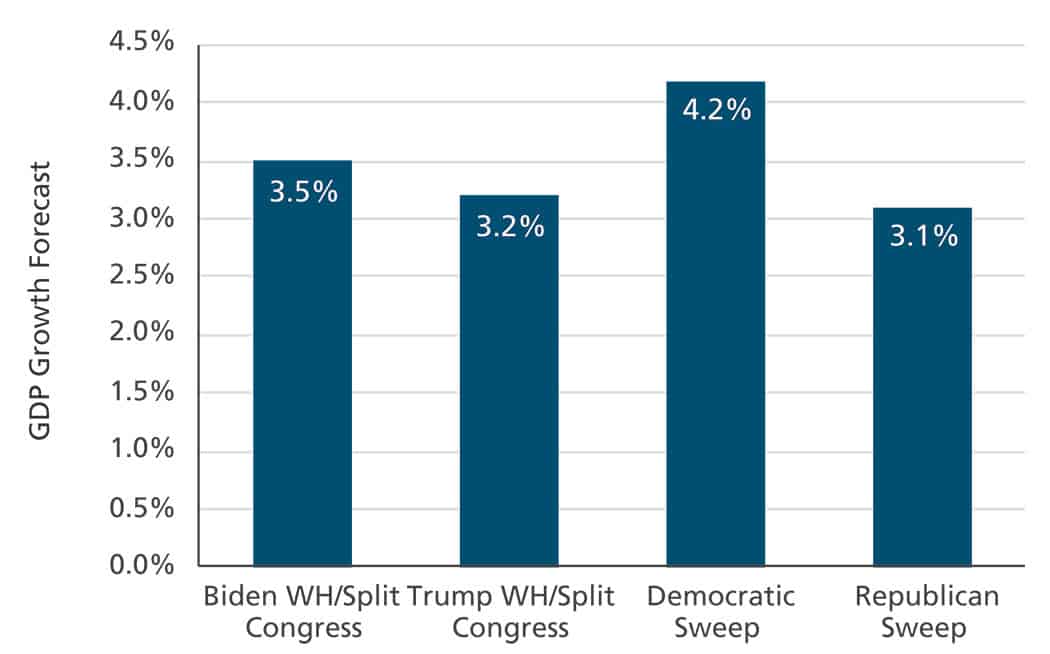
Each of the four bars above shows average GDP growth rates from 2021 to 2024 under different scenarios for the White House and Congress.
The Biden plan is most likely to be implemented in the event of a Blue sweep with a Democratic White House and Congress. In this scenario, shown by the third bar above, growth may well end up being just as good as, or perhaps better than, the levels projected for the other outcomes.
Economies and markets have rarely been affected by elections in the long run. We assign a low probability to a new recession or bear market simply because of election results.
Summary
Global economies have recovered in recent months in an uneven fashion. While policy responses have played a big role in the recovery, investors continue to fret about the potentially adverse effects of higher debt going forward.
- Current fiscal policy seems appropriate from both a humanitarian and economic perspective.
- Low interest rates should lower the fiscal costs of debt.
- Inflation has been conspicuously absent in recent years and may remain contained in the near term.
- Elections rarely affect markets in the long run and they are unlikely to do so this time around as well.
- The overall Biden plan may not be as detrimental to U.S. GDP growth as initially feared.
Footnote1: Olivier Blanchard, “Public Debt and Low Interest Rates”, Working Paper, NBER, February 2019
“The panacea of fiscal stimulus as an economic remedy poses a difficult dilemma for investors”
“Current fiscal policy seems appropriate in light of massive economic disruptions and the likelihood of low inflation and interest rates in the near term.”
From Investments to Family Office to Trustee Services and more, we are your single-source solution.

