


A Mid-Cycle Economic Revival
The current administration entered this presidential term with an ambitious growth agenda based on reform and stimulus. While most policy initiatives were accommodative, there were also some restrictive measures aimed at improving balance in global trade and productivity from government spending.
Unlike Trump 1.0 when stimulative tax cuts preceded the burden of higher tariffs, the sequence of implementation was reversed in this term. Investors were likely caught off-guard by the policy decision to first reduce the federal deficit, through a combination of higher tariff revenues and government job cuts, before embarking on stimulus and deregulation. Saddled with an unusually high peacetime, non-crisis debt burden, this sequence was deemed to afford greater flexibility and maneuverability on the fiscal front.
Both tariffs and job cuts are inherently restrictive and an impediment to growth. Tariffs also raise prices of imported goods and contribute to inflation. As inflation ticked higher, the Fed was left with no choice but to pause its easing cycle and go on hold. Higher prices took an even greater toll on lower income consumers and slowed consumer spending.
Indeed, barring the amazing resilience of AI spending, U.S. GDP growth was close to 0% in the first half of 2025. These economic developments also took their toll on stock prices as the S&P 500 index tumbled to the brink of a bear market.
We wrote extensively in mid-2025 that the market’s worst fears on tariffs, stagflation and recession were unlikely to be realized. At the depth of the sell-off, we continued to argue for a double-digit gain for U.S. stocks in 2025 and for an economic inflection point in late 2025 that would reverse the slowdown.
We believe our forecasted mid-cycle economic revival has already begun. A remarkable surge in economic activity and stock prices in the second half of 2025 exceeded most investor expectations. Third quarter real GDP growth was reported at 4.3% and real-time indicators of fourth quarter GDP growth are clocking in at around 5%. We believe with high conviction that the U.S. economy will sustain this momentum in 2026.
Stocks performed even more spectacularly over the last six months, and for good reason. Stocks are tasked with pricing in future economic outcomes and, in their collective judgment, they signaled a positive economic and earnings outlook for 2026 and 2027. The S&P 500 index gained +17.9% and the Nasdaq index rose by +21.1%. Foreign stock markets had their best year in over a decade as the MSCI All Country World Ex-U.S. index soared by +32.4%.
We expect the current economic expansion to continue in 2026. In fact, we believe growth will reliably catapult to a higher trend level, well above 2%, without any more detours.
We also expect the current bull market to continue, but with one contrast to what happened in 2025. It is safe to say the stock market performed better than the economy did in 2025. Since the stock market has already priced in a lot of future good news into elevated valuations, we believe the reverse is likely to be true in 2026. The economy will perform better than the stock market in 2026. We expect stock returns this year to be positive, but likely muted and well below their recent levels.
We develop our more granular 2026 outlook in this article through the following progression of topics.
- Growth, Inflation and Policy Rates
- Stocks and Bonds
- Key Risks
We recognize that there is a narrower dispersion of views heading into 2026 after five chaotic post-pandemic years. With a more unified consensus, there are fewer opportunities for differentiated insights. We will highlight ours along the way.
Growth, Inflation and Policy Rates
Growth
We begin the growth narrative with a simple observation. Government job cuts and higher tariffs were obvious headwinds to growth in 1H 2025; they will cease to be so in 2026. The program to minimize waste, misappropriation and fraud in government spending has run its course. Reciprocal tariffs now appear to have stabilized at around the 15% level.
We believe most of last year’s tariffs have been absorbed into higher prices by now. We estimate the increase in the average global tariff rate caused inflation to rise by 0.3-0.4%. With no new tariffs on the horizon, inflation should plateau and then resume its downward trend.
With the dissipation of last year’s headwinds, 2026 will see the emergence of three new tailwinds: fiscal stimulus from the One Big Beautiful Bill, lower interest rates from renewed Fed easing and deregulation policies. In addition, 2026 will inherit a fourth powerful growth driver from last year in the form of continued AI spending.
These multiple drivers of growth in 2026 set up a sharp contrast to 2025. Investors were concerned about the narrow base of leadership in 2025 when most of the GDP growth came from AI CapEx. As the U.S. economy continues its upward momentum, leadership will become more diversified this year.
The U.S. economy has also been searching for equilibrium in a New Post-Pandemic Normal. The growth trajectory over the last five years has been anything but normal; virtually every calendar year has been distorted by the influence of policy intervention.
We believe that the U.S. economy will finally normalize at a 2.5-2.6% GDP growth rate in 2026. We are optimistic that growth in future years may tick even higher towards 3.0%. This New Normal stands in sharp contrast to the pre-pandemic cycle of the longest ever U.S. economic expansion when growth averaged just 1.7%.
This higher level of potential growth is driven not so much by short-term fiscal and monetary stimulus, but by powerful structural supply-side changes instead. Policies aimed at enhancing AI and technological leadership, productivity growth, global competitiveness, critical domestic supply chains, foreign investment, production of energy, commodities and materials, national defense and border security will simultaneously boost growth, incomes and profits. As a desirable by-product, the resulting increase in tax revenues (along with a curb on unproductive spending) will reduce fiscal deficits.
Inflation
Fear and skepticism still abound on the future direction of inflation. Many still believe tariffs will remain inflationary. In combination with stronger growth, it is feared that inflation may remain at or above 3% for an extended period.
We are firmly in the opposite camp. We believe the impact of tariffs on prices has largely played out; in addition, we also see several disinflationary factors at play.
1. We have often discussed how shelter inflation moves slowly on a lagged basis and, therefore, is easier to predict. Shelter inflation peaked in March 2023 and has been steadily declining since then. We are aware of the data distortions in this metric caused by the government shutdown but remain confident that shelter disinflation will continue in 2026.
2. The pronounced weakness in the labor market has attracted a lot of attention in recent months. Indeed, it is a big reason the Fed resumed its easing cycle back in September and cut rates three times in 2025. We attribute the slower job growth in recent months to two factors. One, the supply of available workers has gone down because of recent shifts in immigration policies. And two, there is also lower demand for workers as AI gains a foothold and automates jobs.
One of our differentiated views for 2026 and beyond revolves around the future trajectory of job growth. We expect average monthly job growth to be around 100,000 in 2026, which is well below the 150,000-200,000 level one would normally expect in an economy with 2+% GDP growth. For our purposes here, this disappointing labor market outlook bolsters the argument for wage disinflation.
3. Policy reforms to increase oil, steel and critical rare earth minerals production should lead to lower energy prices and resilience in key supply chains. We have already seen a decline in gasoline prices at the pump with significant savings for all consumers. We expect these trends to continue.
4. Our final observation in the disinflation narrative goes back to a theme we have often highlighted. AI and technology are powerful and secular disinflationary forces. Investments in AI are aimed at increasing productivity and profit margins. And these productivity gains are already playing out in a big way. By the third quarter of 2025, labor productivity had risen to almost 5%, a level previously exceeded only twice in history during the recoveries out of the Global Financial Crisis (GFC) and the Covid recession.
We believe most inflation measures will recede to 2.4-2.6% by the end of 2026. These include the headline and core variations of CPI, PPI and PCE inflation metrics.
Policy Rates
The outlook on inflation makes it easier to form a view on the Fed funds, or policy, rate. The nominal policy rate is normally about half a percent higher than inflation. With inflation centered around 2.5% in our outlook by year-end, we can then expect the Fed funds rate to come down to around 3%. Two rate cuts would take the midpoint policy rate to 3.1%; three rate cuts would take it down to 2.9%.
We believe either of these outcomes is plausible and defensible. If the economy is as strong as we expect it to be, the Fed may not be as urgent to act. We conservatively forecast the policy rate to be at 3.1%, and in the 3-3.25% range, by the end of 2026. We believe there is a high probability of a third rate cut to take the policy rate into the 2.75-3% range.
This 3% policy rate forecast is also equal to our estimate of the neutral rate for the U.S. economy. The neutral rate is defined as the equilibrium policy rate that is neither expansionary nor contractionary. We estimate our neutral rate to be lower than the consensus, which is more in the range of 3.3-3.5%.
Stocks and Bonds
Stocks
Our constructive view on the economy translates into a positive outlook for stocks. Earnings growth has been unusually high in recent years because of above-trend economic growth and AI-driven margin expansion.
We believe that earnings growth is now driven more by fundamentals than by post-pandemic policies. Our conviction in this transition highlights an important inflection point as we switch from the liquidity-induced phase of the bull market to the earnings-driven phase.
The policy response to the Covid recession was an unprecedented level of monetary and fiscal stimulus. Any liquidity injection to combat a recession typically leads to an expansion of Price/Earnings (P/E) multiples. Prices adjust rapidly and well in advance of the actual improvement in earnings that the liquidity is designed to achieve.
Valuations appear lofty during this phase because of the asymmetric timing of the rapid price spike and the lagged recovery in earnings. For the bull market to persist, earnings must eventually improve. In this earnings-driven phase, earnings typically grow faster than prices; this reverse asymmetry causes P/E multiples to compress and valuations to normalize.
Even though the post-pandemic economic cycle has been chaotic and turbulent, we are able to see the growing influence of earnings on stock prices in Figure 1 below.
Figure 1: Historical S&P 500 Returns
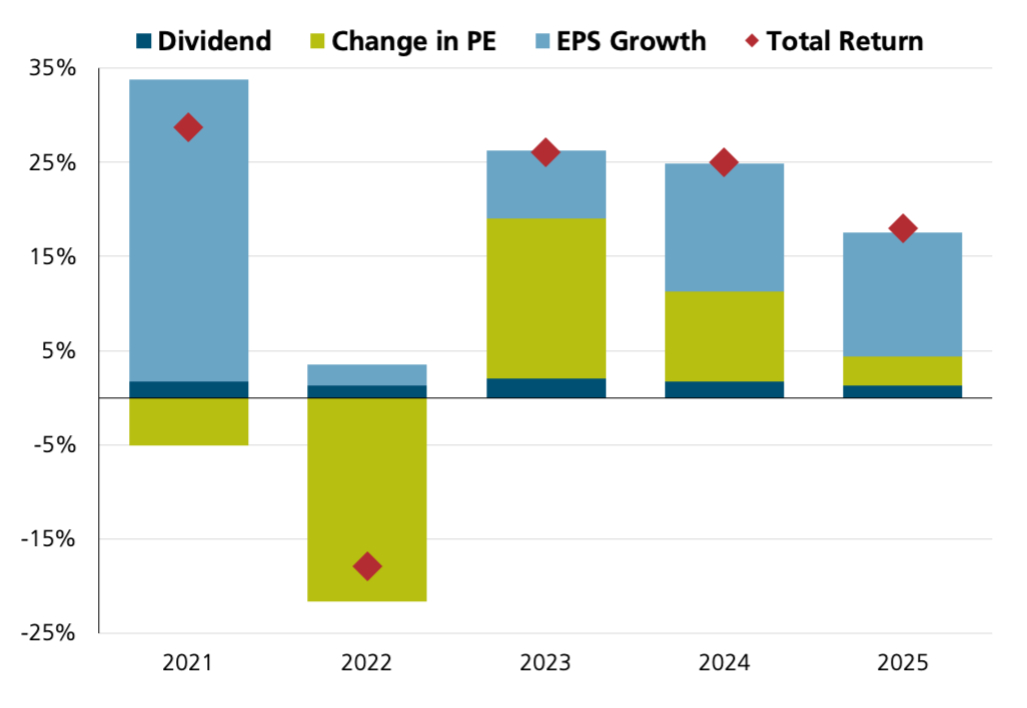

Source: The Daily Shot
In the last three years, earnings growth (shown in teal) has been a progressively bigger part of the S&P 500 total return. At the same time, changes in the P/E multiple (shown in green) have become a smaller component of stock returns. In 2025, almost all of the S&P 500 return came from earnings growth.
We expect this trend to hold true in 2026. U.S. stock prices will be driven almost entirely by growth in forward earnings estimates. We believe that the S&P 500 forward P/E of 21.8 at the end of 2025 is mildly elevated and likely to compress by 3-5% in 2026.
We use this framework to develop our outlook for equities and its key sub-asset classes.
We expect S&P 500 earnings growth in 2026 to be around 14%, but those expectations have already been priced in and are reflected in today’s forward P/E multiple. We expect S&P 500 earnings to grow by another 14% in 2027 to a range of 350-355.
These earnings growth projections are lofty by historical standards. A big driver of higher earnings growth in recent years has been steadily increasing profit margins. We recognize the concern that profit margins cannot keep increasing forever. In the past, they have tended to revert back to some mean or average level; in the best scenario, they simply level off at a higher level and stop growing.
Our high future earnings estimates actually don’t rely so much on continued margin expansion. They are derived instead from higher revenue growth, which, in turn, is supported by higher-than-average nominal GDP growth. We offer evidence to support this assertion.
Revenue growth for the S&P 500 index is projected to be handily above 7% in 2026. Even more remarkably, a historically high percentage of S&P 500 companies are expected to exceed the rare threshold of double-digit revenue growth. We show that below in Figure 2.
Figure 2: Breadth of 2026 Revenue Growth in S&P 500 Sectors
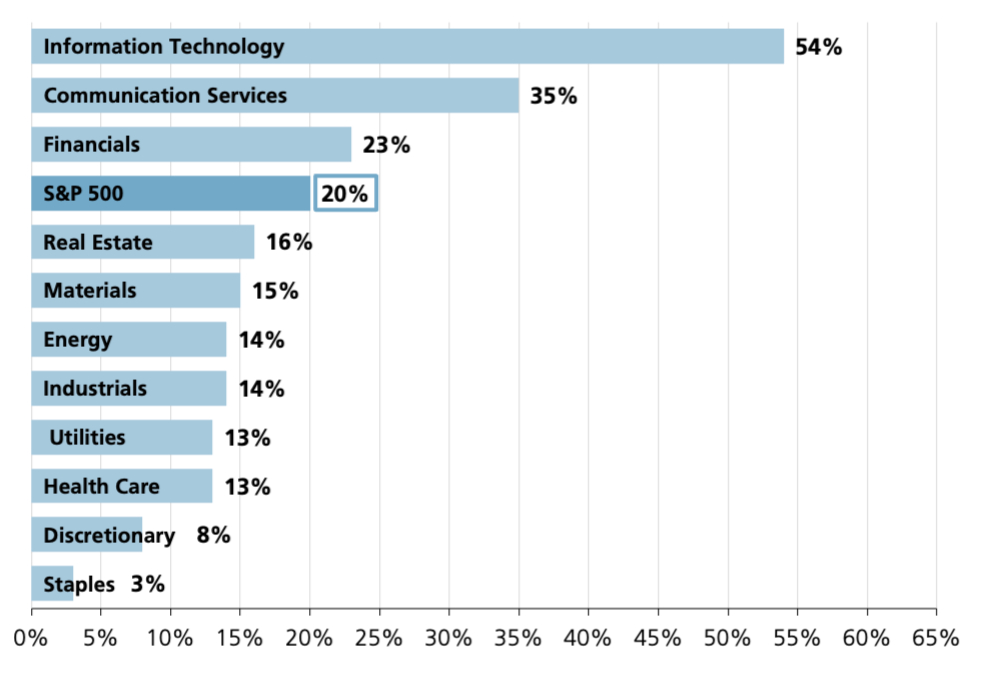

Source: Wolfe Research
102 of the S&P 500 companies, or about 20% of index constituents, are expected to deliver revenue growth of 10% or more. This data point is captured in the fourth bar from the top in Figure 2. Three sectors have a higher percentage of companies that are expected to grow revenues by 10+%. Not surprisingly, Technology and Communication Services, home to some of the best AI companies in the world, lead the market in terms of high-revenue-growth constituents.
Against this backdrop of “high GDP growth => high revenue growth => high profit growth” cascade, we move ahead with our 2026 U.S. equity outlook. We use a 2027 earnings growth rate of around 14% and 2027 earnings estimates of 350-355 in the process.
We believe these 2027 earnings estimates will likely be valued at a forward P/E multiple of around 21 times. In this setting, we leave open the possibility of a multiple compression of up to -5% as an offset to the 2027 earnings growth estimates. These parameters lead us to a likely S&P 500 range of 7,400-7,500 at the end of 2026. We expect a total return for the S&P 500 index of 8-10% in 2026.
We assign a low probability to a bear market. We also believe there is more room for a modest upside surprise to our outlook than the risk of a shortfall.
We expect a continued broadening of the global equity markets. International stocks and value stocks are not as stretched on valuations and could offer attractive returns from both multiple expansion and higher earnings growth. Small cap stocks generally perform well in the early stages of a recovery or a revival and may merit a selective closer look.
Our investment philosophy is rooted in seeking out high quality companies with sustainable profit growth. We remain committed to this ideal in our pursuit of new opportunities in the international, value and small cap segments of the market.
Bonds
We have some of the building blocks for a bond market outlook in the form of expected inflation and policy rates in 2026.
We believe inflation will be contained in a 2.4-2.6% range at the end of 2026. However, the 10-year bond yield is influenced more by long-term inflation expectations than by any contemporaneous measure of inflation. Longer-term inflation expectations have remained remarkably well-anchored in the midst of significant bond market turmoil in the last five years and stand today at 2.2-2.3%. We forecast the neutral rate for the U.S. economy to be around 3% and expect the midpoint Fed funds rate to be in the range of 2.9-3.1% at the end of 2026.
With these views on the short end of the yield curve, the only remaining discussion revolves around the term premium embedded in long-term bonds. In its simplest definition, the term premium is the compensation that investors require for lending money for a longer period and facing greater uncertainty. We use a few different approaches to converge on an estimate for the 10-year bond yield.
Given our above-trend growth outlook, we expect the yield curve to steepen from its recent inverted-and-then-flat shape. We expect the steepening to evolve from falling short rates and steady long rates. Nominal long-term rates are driven primarily by inflation expectations and real growth rates. We attribute the steeper yield curve to a sustainable increase in real growth rates and not to any realistic possibility of the loss of Fed independence.
Outside of the unusual post-GFC and post-Covid cycles of ultra-easy monetary policy, the real 10-year bond yield (nominal minus inflation) has averaged around 2% for the last 3 decades. In normal parts of the economic cycle, the spread between long-term and short-term Treasury rates has ranged between 0.5-2.0%.
We expect the 10-year bond yield will remain in the 4.0-4.2% range at the end of 2026 based on our assessment of inflation, growth, short rates and the historical priors described above. We anticipate a total return of 4-5% for a conservative bond portfolio with modest credit exposure.
Key Risks
AI CapEx
Investors are concerned about the risks associated with high levels of AI spending. This capital expenditure clearly strives to earn a commensurate return on investment. However, many worry that excessive spending will not only outpace but eventually dwarf any practical rewards in the form of higher margins and returns. These fears are further exacerbated by the rapid depreciation rates of these investments and growing competition.
At the same time, the third quarter of 2025 saw soaring stock prices for many of these AI companies. High valuations have compounded the basic concern that a lot of AI spending may come to nought and eventually be unproductive.
We summarize our thoughts on the topic along the following dichotomy.
a. We believe several speculative “AI mini bubbles” have already formed. We urge caution in making any of the following investments.
- Companies that borrow more to spend more on AI
- Unprofitable companies with high imminent spending and deferred revenue growth
- Small companies with no competitive advantage and ability to scale
- Stocks that are already at unsustainable valuations e.g. Price/Sales ratios > 100
b. At the same time, we believe we are not in a pervasive “AI everywhere” bubble. The large hyperscalers (Microsoft, Amazon, Google and Meta) are still able to fund their AI investments out of operating cash flow. They are also well-established, highly profitable companies with strong fundamentals. We believe these larger AI players with a bigger economic footprint are not at significant risk; they are certainly not in bubble territory.
Geopolitical
Venezuela, Iran and Greenland have featured prominently in the news in recent weeks. We offer brief comments on the broad topic; our brevity and parsimony are dictated by two considerations.
First, geopolitical events rarely have a material or lasting impact on markets. They simply do not justify the airtime for that reason alone. Second, an extended discussion on this topic runs the risk of drifting into political commentary, which we wish to refrain from.
We believe U.S. actions in both Venezuela and Iran are best understood as efforts to establish military and economic deterrents against hostile regimes such as the ones in China and Russia. Venezuela, in particular, had evolved into a rare convergence point where Chinese, Iranian and Russian interests overlapped simultaneously in the Western Hemisphere. U.S. influence in Venezuela disrupts Chinese energy supply chains, while indirectly weakening Russia’s and Iran’s ability to monetize oil exports.
Unlike Venezuela or Iran, Greenland operates as an autonomous territory of Denmark with no ties to China or Russia. Greenland sits between the U.S. and Europe along critical Arctic and North Atlantic routes, including emerging shipping lanes and strategically significant locations linking the U.S., Russia and China.
Its relevance is geographic rather than political and its position carries increasing importance as Arctic access expands.
- Enhanced national security positioning for the U.S. and Europe
- Access to significant natural resources, including oil, gas and rare earth minerals
- Control and monitoring of emerging Arctic and North Atlantic shipping lanes
The U.S. strategy in Greenland may be viewed as preemptive deterrence aimed at limiting future adversarial access and reducing the risk of disruption to global security and trade.
Conclusions
Our first publication of 2026 focused on our economic and market outlook for the upcoming year. Our views, beliefs and forecasts are summarized below.
- Real U.S. GDP growth will reliably and handily exceed 2% from 2026 onwards without major disruptions.
- We expect real GDP growth to be 2.5-2.6% in 2026.
- The U.S. economy will become more diversified in leadership as the new drivers of fiscal policy, lower interest rates and deregulation augment AI spending.
- Beyond 2026, the U.S. will be able to achieve a higher level of potential growth based on AI and technological leadership, productivity growth, global competitiveness, critical domestic supply chains, and lower energy and materials costs.
- We assign a very low probability to a recession in 2026.
- Inflation will resume its downward trajectory and descend to 2.4-2.6% by the end of 2026. Major disinflationary forces include shelter, wages, energy costs and technology.
- We believe the neutral rate for the U.S. economy is around 3% with some more room to the downside.
- We believe the Fed will get to the neutral rate in 2026 with two or three rate cuts.
- Stock returns will be positive but more muted than those in the last three years.
- We assign a low probability to a bear market.
- We expect the S&P 500 index to be at 7,400-7,500 at the end of 2026.
- The total return for the S&P 500 index will likely be 8-10% in 2026. We see more room for a modest upside surprise here than the risk of a shortfall.
- We expect the 10-year bond yield to remain at 4.0-4.2% at the end of 2026. We anticipate a 4-5% total return for a conservative bond portfolio with modest credit exposure.
We are more constructive on the U.S. economy than we have been in the recent past. We believe a number of structural supply-side changes will lift the U.S. to a higher level of potential growth approaching 3% in future years.
Our optimism for the future will not distract us from the care and diligence we bring to the portfolio management process. We remain vigilant and focused on behalf of our clients.
To learn more about our views on the market or to speak with an advisor about our services, visit our Contact Page.
Download PDF
Real U.S. GDP growth will handily exceed 2% from 2026 onwards without major disruptions.
The U.S. will achieve higher potential growth based on AI leadership, productivity growth, global competitiveness and lower energy costs.
Inflation will resume its downward trajectory and descend to 2.4-2.6% by the end of 2026.
The total return for the S&P 500 index will likely be 8-10% in 2026.
From Investments to Family Office to Trustee Services and more, we are your single-source solution.
Contact Us
